See the whole operation at a glance
A live dashboard for the warehouse wall and a watchdog that quietly keeps the stack healthy — so problems get fixed before they reach a customer, often before you notice them.
What it does
Live ops view, self-healing underneath
- Office-TV dashboard with live tiles for orders, inventory, shipments, and alerts.
- Event log + real-time updates stream activity as it happens (server-sent events).
- Self-healing watchdog runs hourly with both reactive and proactive healers.
- Automatic backups so a bad day is always recoverable.
- Cron fleet visibility: pollers, audits, feeds, sweeps, and summaries, all observable.
| Dashboard | FastAPI service, live collectors, TV-friendly layout |
|---|---|
| Real-time | Event-log table + SSE tiles |
| Self-heal | Hourly watchdog, reactive + proactive healers, backups |
| Cron fleet | Poller, audits, feeds, deindex, sweeps, summaries |
Integrations
| Integration | Required |
|---|---|
| MariaDB | Yes |
| WooCommerce REST | Yes |
| eBay | If on eBay |
| Email gateway (alerts) | Recommended |
See it
The office-TV view
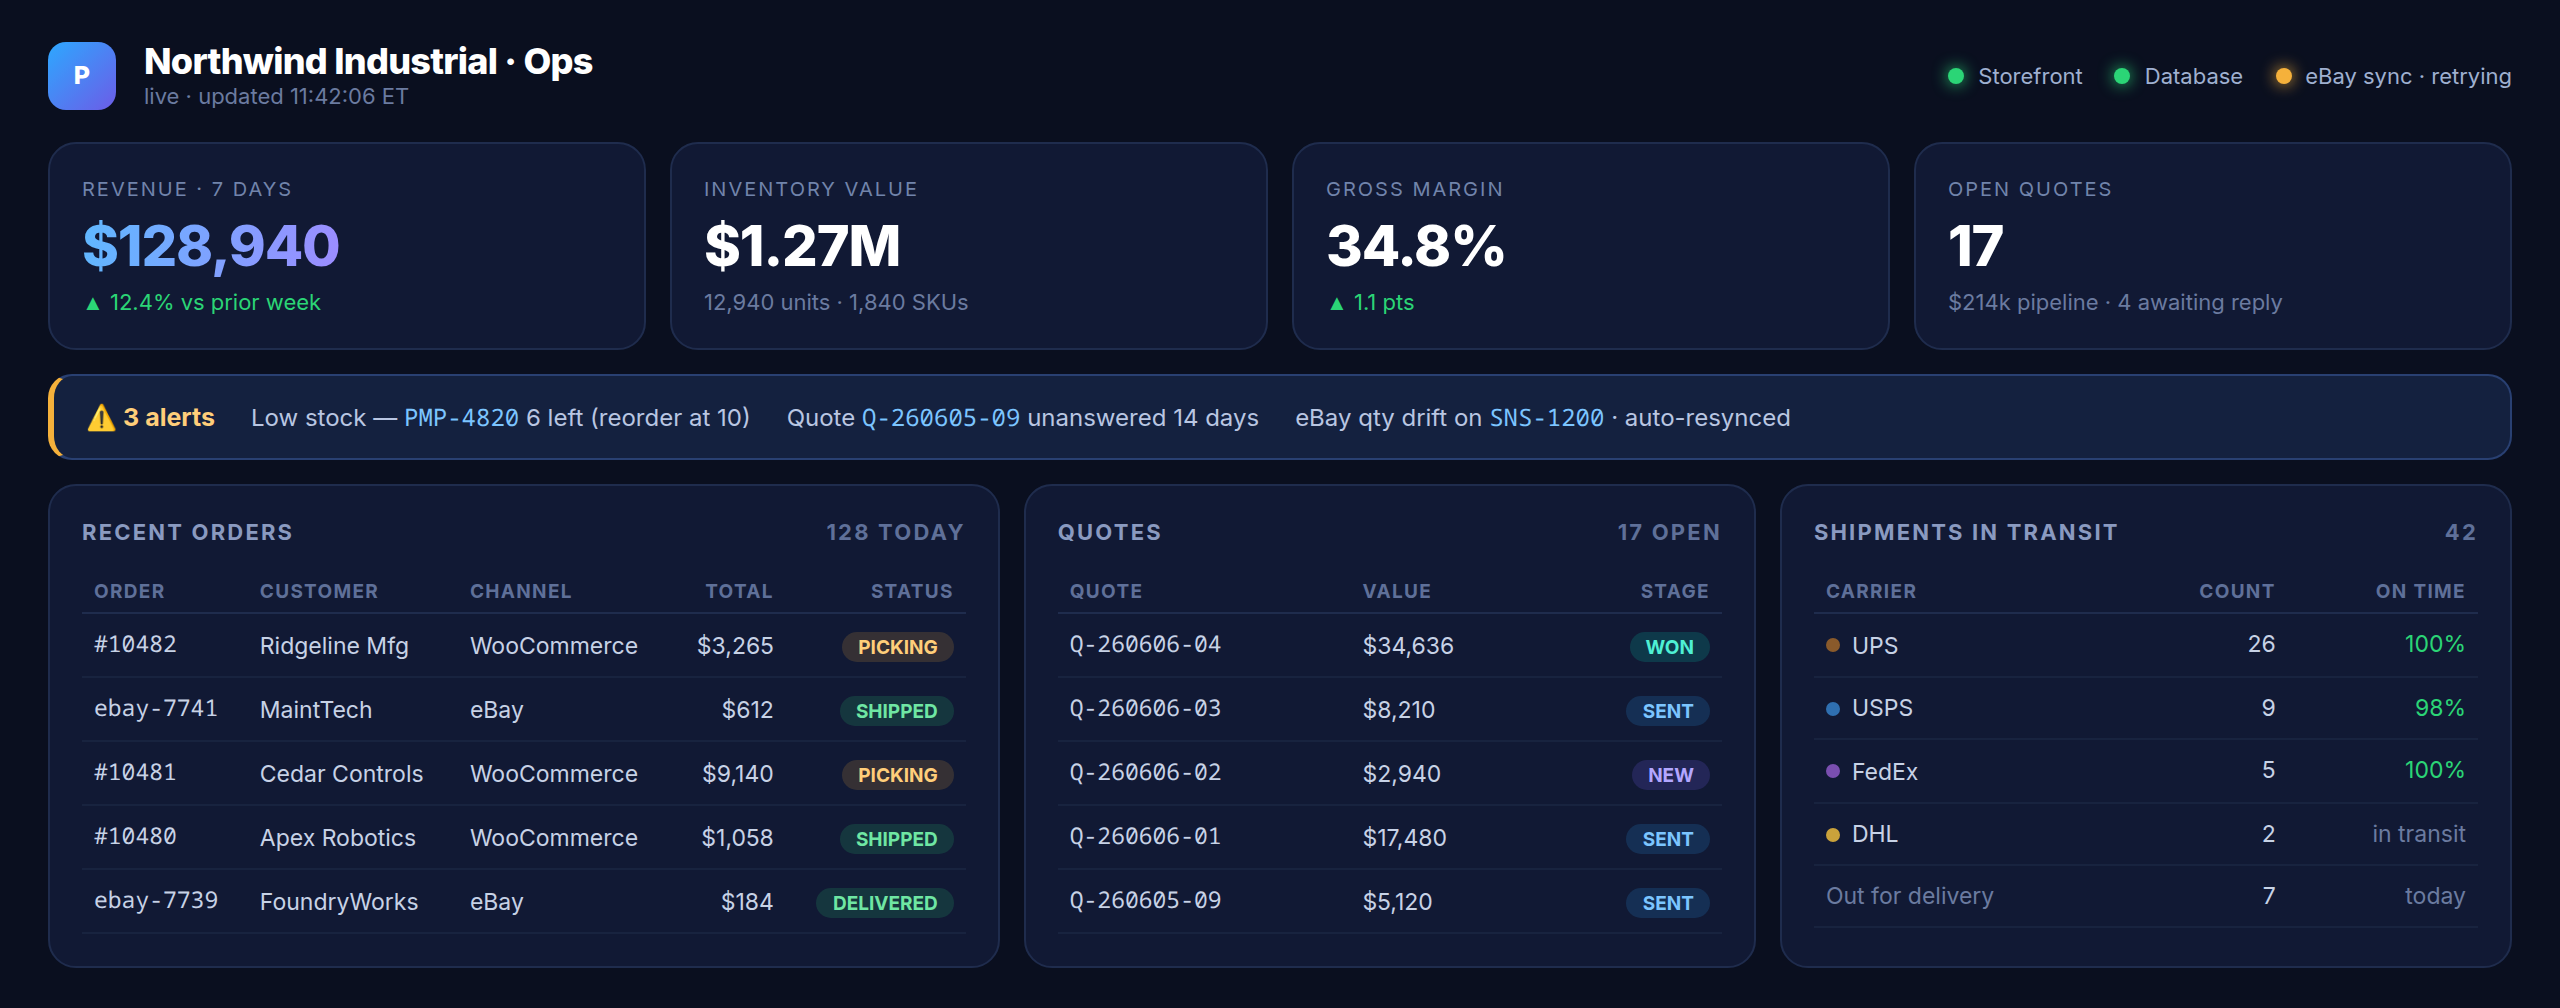
Representative dashboard with sample data.
In practice
How teams actually use it
On the warehouse wall
Left running on a TV, it’s the shared heartbeat: orders to pick, what’s shipping, and anything stuck — visible to the whole floor without anyone opening a report.
Morning triage
Start the day on the alerts bar: low-stock SKUs to reorder, quotes going cold, sync drift already auto-fixed. Two minutes tells you where to spend the hour.
Owner’s glance
Revenue, margin, and pipeline up top — the numbers that matter at a glance, from your phone, without pulling anyone off the floor to build a spreadsheet.
Behind the scenes, an hourly self-healing watchdog and automatic backups keep the stack honest.
It’s managed — so we watch it too
Because we run your instance, the same observability that powers your dashboard powers our support.
How we deliver → See plans